Website: iSpy Connect
About
iSpyConnect is the web interface for iSpy. Using iSpyConnect you can access and control iSpy on your local network or over the web from anywhere. iSpy secures access through iSpyConnect with authentication tokens to ensure that you and only you can access live and recorded content. Once authenticated, the web browser accesses iSpy directly, bypassing the website and ensuring your connection is as fast as possible. iSpyConnect will even use your LAN IP address if possible to bypass the web entirely and prevent loopback errors. You need to create an account to use iSpyConnect. See Configuring Web Access for more details.
Important:
- iSpyConnect is a complex web application and will only work on the latest web browsers. Recommended browsers are Google Chrome (preferred), IE 9, Firefox and Safari. iSpyConnect does not currently work with Opera. Live audio currently only works with Google Chrome.
- You will either need Flash installed or an HTML 5 compatible web browser (with video support!) to view videos.
Account Settings
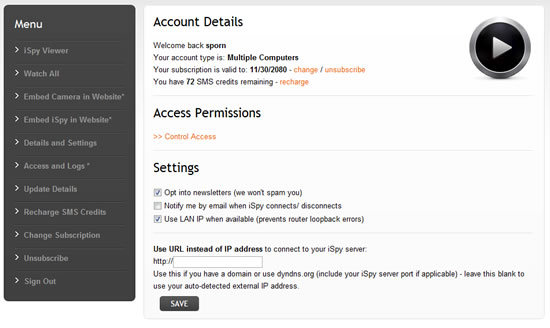
When you sign in to iSpyConnect you will see your account page. From here you can manage your subscription, control access permissions, modify your preferences, set up a DynDNS.org address etc.
On the left of this page are quite a few options - we'll cover all these in the following sections.
Giving others Access
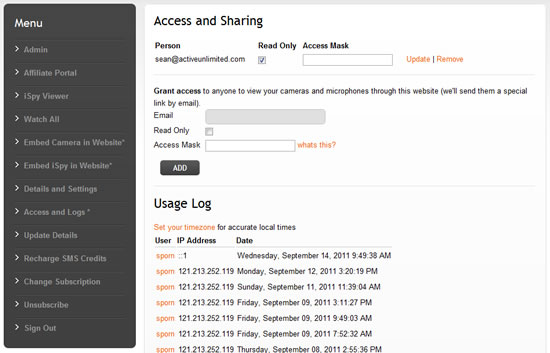
iSpyConnect allows you to share access to your cameras and microphones with friends, family, customers or co-workers (subscribers only). To give someone else access click on the "Access and Logs" link on the left hand menu. When you give someone access to iSpy we send them a special link by email. You can grant them full access (they are able to switch on/off, record, delete etc) or read-only access and you can revoke access at any time through the same page.
When they login to ispyconnect they will see a link on their account page under "ACCESS PERMISSIONS" to view content on your iSpy server.
Access Mask
You can specify an access mask to restrict the cameras and microphones available to certain people. The access mask uses the "Groups" field from the camera or microphone (on the first tab when editing the camera or microphone in iSpy) to determine whether to grant access or not. For example, if you enter "Office,Family,Dad" under groups and then you enter "Family" in the access mask field on this page then this person WILL be able to see this camera. If you entered "Neighbours" in the access mask field then they would NOT be able to view it. You can enter multiple access groups here - just separate them with a ','. Note that if you leave this field blank then the person will be able to view ALL cameras and microphones (default).
To prevent a camera or microphone from appearing in iSpyConnect you can use the special group name "exclude" (case sensitive).
Note that the groups field is also used by the http and command line interface.
Tracking Usage
iSpyConnect keeps a log of every user and IP address that logs into iSpy and accesses your account. You can keep track of this information on this page under "Usage Log". Clicking on the username brings up an email link for that person.
Searching, Filtering and Sorting Content
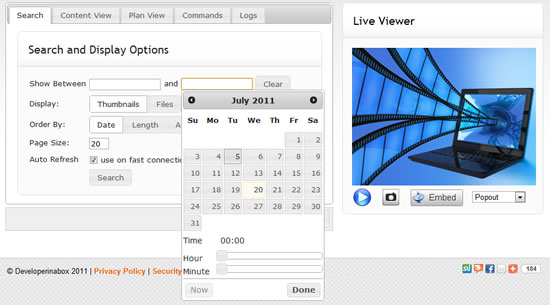
This is the main watch page for iSpy and is where you view live video and audio feeds, captured content and pretty much everything else. iSpy stores a fair amount of data with the files it captures which enables iSpy to search, order and filter videos accurately and quickly.
Use the tabs along the top to access your saved content, floorplans, remote commands and logs.
Tips:
- By default the search page imposes no restrictions on the content returned. If you add a date range in iSpy will filter all the content to that date-range so it's quite likely that new content won't appear (unless of course it falls within your date range) - to get at the new content, click Clear on the Search page and click Search again.
- If you are on a slow connection, or if you just prefer it, you can tell iSpyConnect to display a list of files instead of thumbnails for the videos by changing the "Display Type".
- You can order the content by Date (default), Length or Activity.
- Using the Auto Refresh option can cause issues on slow connections (by slow we mean dialup). If you are experiencing script errors or browser hangups try disabling auto refresh.
Viewing Content Online
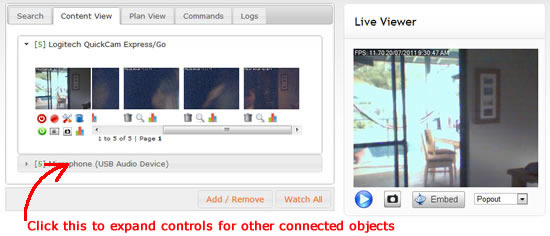
This tab contains all the stored content and controls for all connected cameras and microphones. Click the left-most thumbnail (a live grab from your camera) to watch live video in the "Live Viewer" on the right. The scrollable area to the right of the thumbnail contains all the content that this camera has recorded.
The images in this scrollable container are saved at the point of maximum movement through the recording. Clicking on the thumbnail will play the content through either a Flash player or HTML5 player (if Flash isn't available).
The three icons below each video thumbnail are controls to delete, view a full resolution image of the maximum motion frame and view the activity information for the file.
 The icons below the thumbnail perform the following functions (left to right):
| Switch On/ Off | Record/ stop | Configure | Delete All Content |
| Refresh Files | Show File List | Take Snapshot | Show Activity Graph |
You can access content or live feeds from other cameras and microphones by expanding the panel for that object. To conserve space, processing power and bandwidth iSpyConnect displays content for one object at a time.
Changing Configuration Setttings
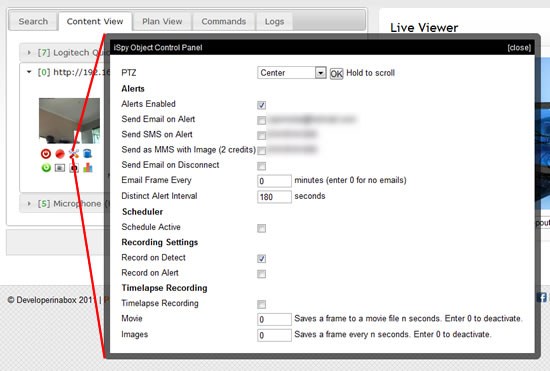
iSpyConnect lets you remotely configure pretty much all settings of your cameras remotely (except for the schedule which is read-only). Click on the spanner icon below a camera or microphone thumbnail to open the control panel for that object.
Important: These controls are live controls - there is no save button on the panel, as soon as you check a checkbox or modify an entry that setting is updated in iSpy.
Switching Alerts On or Off
Switching Alerts On or Off
If you are away from home or work and you are getting alerts you can switch them off here by opening the control panel and unchecking the "Alerts Enabled" checkbox.
Using PTZ Remotely
Using PTZ Remotely
iSpyConnect supports the full range of PTZ controls that iSpy does. The PTZ control is only displayed if your camera supports PTZ (and you have selected the PTZ control in camera settings). To execute a PTZ command select it from the drop-down on the control panel and click OK. To Pan in a direction hold the OK button down.
Live Feeds
iSpyConnect supports live feeds from both cameras and microphones.

Live video is available through iSpyConnect in a variety of resolutions. The "Live Viewer" on the right displays a live feed from your camera at 320 x 240px. You can select a different resolution for the live feed from the drop-down underneath - any size up to the native size of your camera. When you choose a different resolution the video feed pops up in a bigger (or smaller) window.
Live Audio
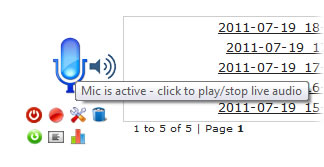 Click on the microphone icon (for a microphone source) to play live audio through the web browser. There may be a short delay between clicking the icon and hearing the audio (whilst it buffers).
Accessing MJPEG Push and JPEG Streams
You can integrate video streams from ispy in other applications by accessing the local server directly. To access a stream you should first add the IP address of the computer that will be accessing ispy into your "Allowed IP Addresses" list in Settings. You can then use the following URLs:
JPEG Frames
- http://IPADDRESS:8080/livefeed?oid=CAM_ID&full : full size still snapshot
- http://IPADDRESS:8080/livefeed?oid=CAM_ID&thumb : thumbnail snapshot
- http://IPADDRESS:8080/livefeed?oid=CAM_ID&size=640x480 : resized snapshot
MJPEG Video Feeds
- http://IPADDRESS:8080/mjpegfeed?oid=CAM_ID&full : full size movie
- http://IPADDRESS:8080/mjpegfeed?oid=CAM_ID&thumb : thumbnail movie
- http://IPADDRESS:8080/mjpegfeed?oid=CAM_ID&size=640x480 : resized movie
Where IPADDRESS is the IP address of the computer running ispy and CAM_ID is the ID of the camera you want a feed from (you can find the ID by clicking "Edit" on the camera - it will be displayed in the title bar of the form).
Playback
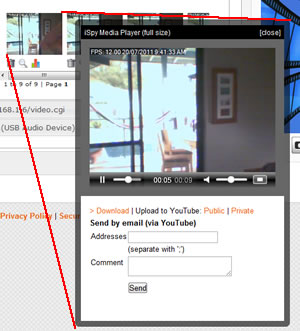 To playback a video click on that videos thumbnail in the content viewer. iSpyConnect plays back your captured videos in full resolution. To do this it pops them up in a dynamic windows. You can view these videos fullscreen by clicking the expand icon in the bottom right corner of the player. If you don't have flash installed iSpy will try to use HTML5. Only some of the newest web browsers currently support HTML5 video.
You can also playback captured content locally. Right click on a thumbnail in ispy and select your preferred playback option or see Settings to set a default.
Activity Graphs
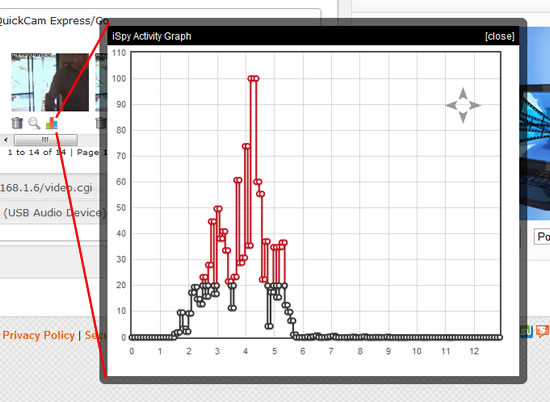
iSpy keeps track of the activity detected during recording and exposes this information in activity graphs. These graphs are available on a per-recording or based on the full list of files that result from your search criteria. The red points indicate motion that falls above the motion triggee and the black is motion that isn't enough to trigger the motion detector.
Clicking to view the activity graph for the camera or microphone itself shows the graph of maximum trigger values over the defined date range. You can mouse-over the data points on this graph and iSpyConnect will display the full resolution preview image for that recording (click it to play the associated video or audio).
File Browser
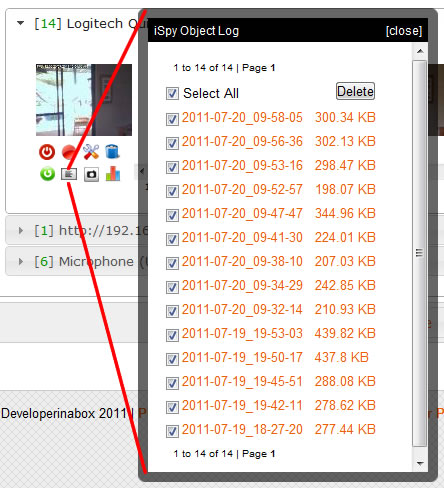
If you are working with a lot of files or want to delete a lot of content to free up space then use the file browser. The file browser uses the same search criteria that controls which files display on the main content viewer. The file browser will display up to 200 files per page.
The file list view also lets you see exactly how much space each file is taking up on disk. When you delete a movie file iSpy will automatically delete the associated thumbnail and preview image and clear the data from the xml statistics file - so it's far better to do it through here than to delete the content via windows explorer.
Embedding Cameras in your Website
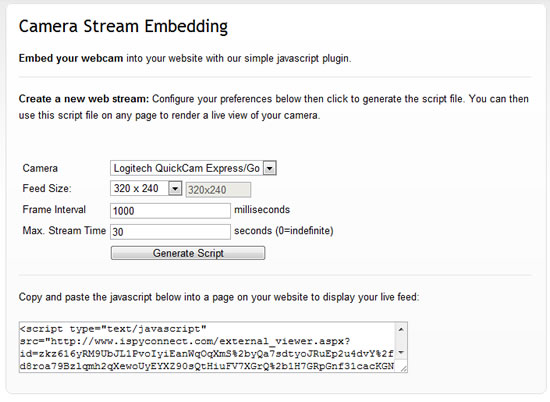
iSpyConnect can generate a script file that enables you to embed a feed from your cameras in your own website. You can generate as many feeds as you like and even combine them on the same page. To access this click the "Embed" button below the "Live Viewer" or click "Embed Camera in Website" link on the menu on your account page. You can specify the feed size, frame interval (time to pause between successive frame requests to save bandwidth) and the maximum stream time. iSpyConnect encrypts this configuration to prevent people from modifying the settings.
Embedding iSpyConnect in your Website
You can embed the whole iSpy Viewer in your own website. To do this click on "Embed Viewer" link on the tools menu on your account page. Please note that embedding works with iSpy, not Agent. To embed with Agent you need to setup streaming to Twitch or YouTube and use an html5 player from them on your website.
Like with the camera plugin these configuration settings are encrypted to prevent people changing the settings.
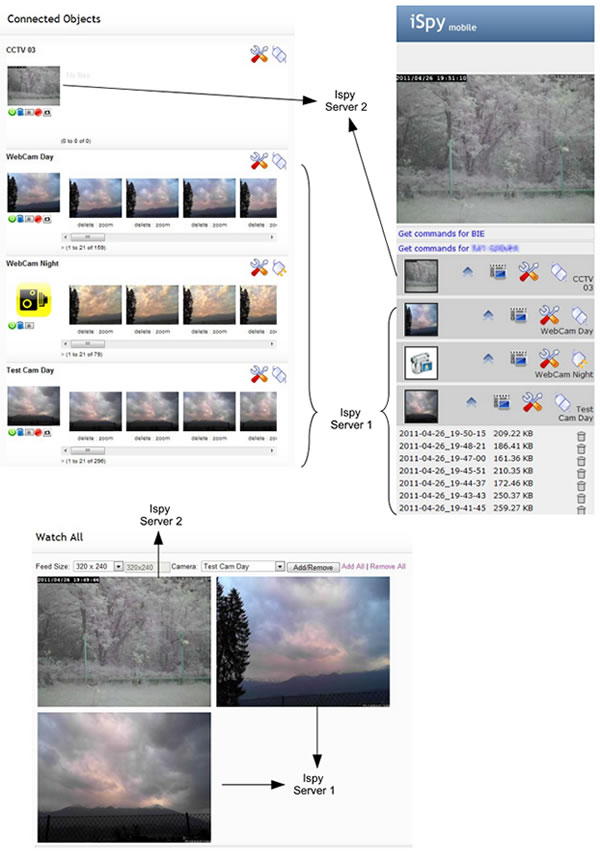
Simultaneous Viewing
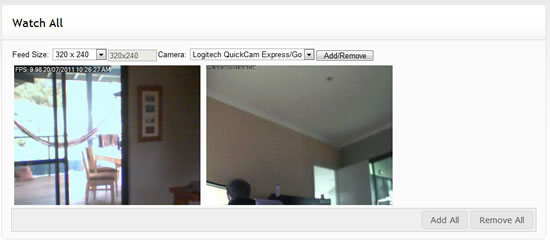
You can watch multiple cameras at once over the web with the "Watch All" page. Access this page from the main content viewer link at the bottom or from the menu list on your account page. You can add whatever feeds you like to this page and specify what resolutions you want them to play at. iSpyConnect will remember your configuration if you refresh the page.
Using Floor Plans
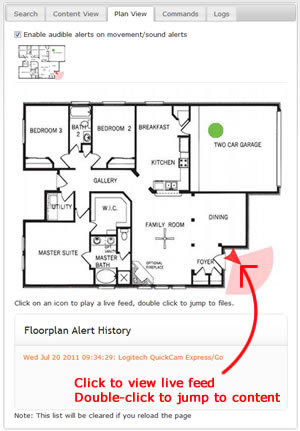 The floorplans you add into iSpy are exposed through iSpyConnect. These floorplans give you a good overview of the current state of your cameras and microphones and are updated in real-time. The thumbnails along the top of this tab (there's just one in this example but iSpy supports an unlimited number of floorplans) are also live. Any alerts that are triggered will automatically cause a refresh of these plans. You can also click on the cameras in the floorplan to view a live feed in the Live Viewer and double-click them to jump to the content view for that object (this applies to microphones as well).
The flooplan alert history provides a text summary of all the events that have come through since the web page was opened. Click on an entry here to jump to the saved content for that object.
Live Floorplan Alerts
The checkbox (top of tab) enables or disables audio alerts through the browser. If any camera or microphone on any floorplan is triggered by an alert iSpyConnect will play an alert sound. You will then be able to switch to this tab to see the highlighted object that is in the alert state. If you miss this event it will be recorded in the Floorplan Alert History.
Using Multiple Computers
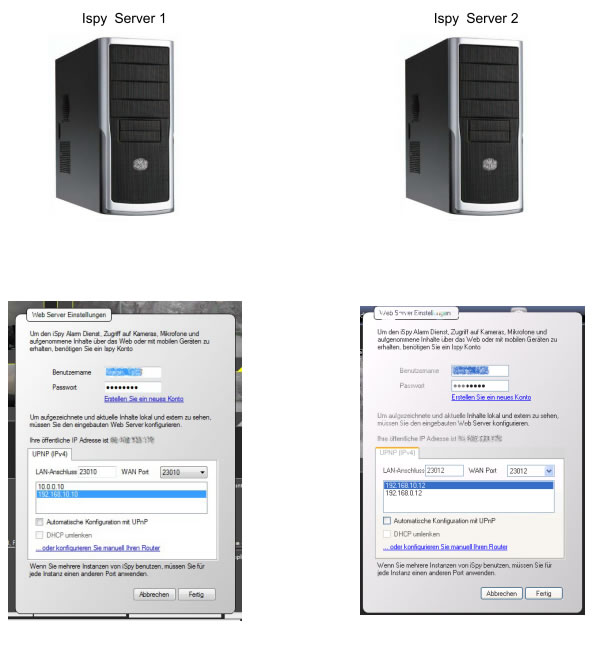
With one iSpy account you can access and control cameras and microphones on multiple computers Use the same login details for each computer and just specify a different port. All connected cameras and microphones will be fully accessible from our website as long as your router is setup to forward those ports to the relevant computers on your network. You may for example setup 2 ispy servers, one at home and one at work. You can then access live and recorded content from both anywhere in the world via this website.
For Example:
Mobile Device Access
iSpyConnect provides a mobile version here: here.
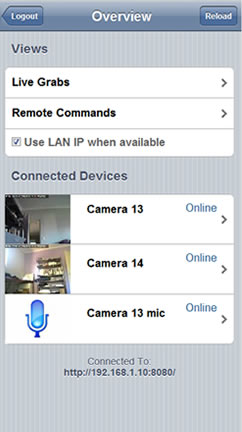 The mobile iSpyConnect website lets you do nearly everything the main iSpyConnect site can. The view is formatted for display on iPhones, Android and Windows 7 phones (subject to HTML5 availability).
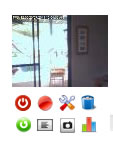
Press the thumbnails to view a live feed, or click the icons along each row to access stored content (audio and video with bulk delete), control panel or to switch on/ off the object.
The mobile iSpyConnect website lets you do nearly everything the main iSpyConnect site can. The view is formatted for display on iPhones, Android and Windows 7 phones (subject to HTML5 availability).
Press the thumbnails to view a live feed, or click the icons along each row to access stored content (audio and video with bulk delete), control panel or to switch on/ off the object.
You can install this as an application on your iPhone or iPad device by navigating to http://www.ispyconnect.com/mobile in Safari and clicking on the prompt to add it to your home screen.