Overview and Dashboards
Overview
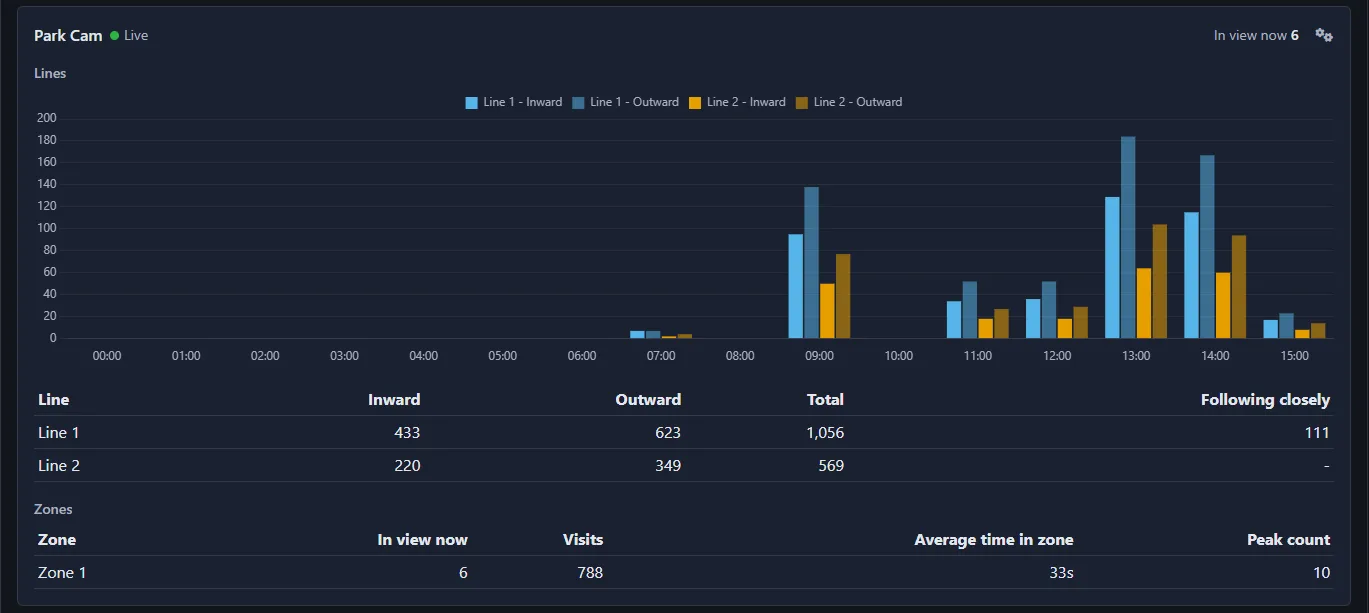
The Overview tab is ready as soon as a camera is set up. It has a card for every camera with analytics enabled, showing how many objects are in view now, a chart and table of the crossings of each of its lines, and a table of its zones. Choose the period at the top left (Today, Yesterday, Last 7 days, Last 30 days or Custom) and step backwards and forwards with the arrows. The button on a card opens that camera's analytics settings.
The dot beside a camera's name shows whether its figures are Live or the camera is Offline.
Dashboards
A dashboard is a page of reports that you choose and arrange. Click + beside the tabs to add one, give it a name, then use Add report to fill it. Dashboards are stored on the server and are shared by everyone who can see Analytics.
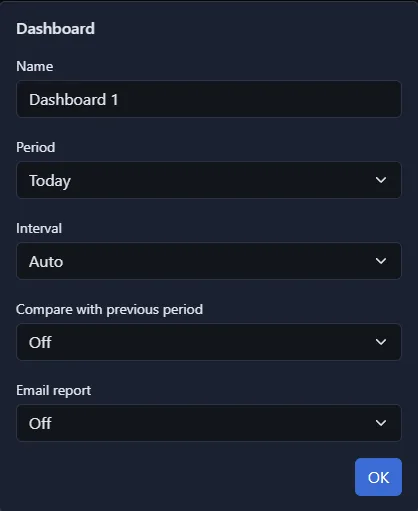
The button at the top left of a dashboard opens its settings:
- Name: The name on the tab.
- Period: What the dashboard shows when it is opened: Today, Yesterday, Last 7 days, Last 30 days or Custom dates.
- Interval: The width of each bar in the charts: Hourly, Daily or Auto, which chooses for you from the period.
- Compare with previous period: Draws the period before (or the two or three before) as lines over a Lines report's bars, so you can see today against yesterday, or this week against the last three.
- Email report: Sends the dashboard by email every day or every week. See Emailed Reports, CSV and Printing.
Each report on a dashboard has buttons at its top right to move it up or down and to edit it; the report editor has a delete button. Reports arrange themselves to fit the width of the page. The button deletes the whole dashboard: click it twice to confirm.
Charts and figures on a dashboard that runs up to now refresh by themselves. Use the button to reload everything.
Report Types: Heatmaps, Footfall, Dwell Time
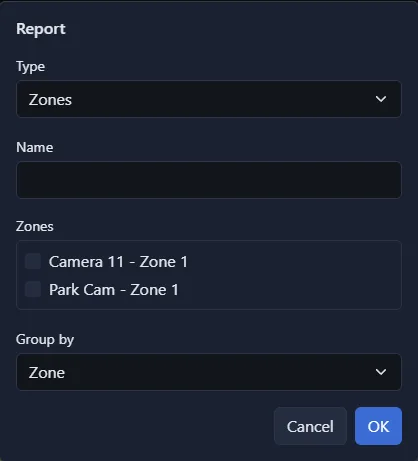
Click Add report on a dashboard, choose the Type, and then the lines, zones or camera it is about. Lines and zones from different cameras can go in one report. A Name is optional; without one the report is titled from what it shows.
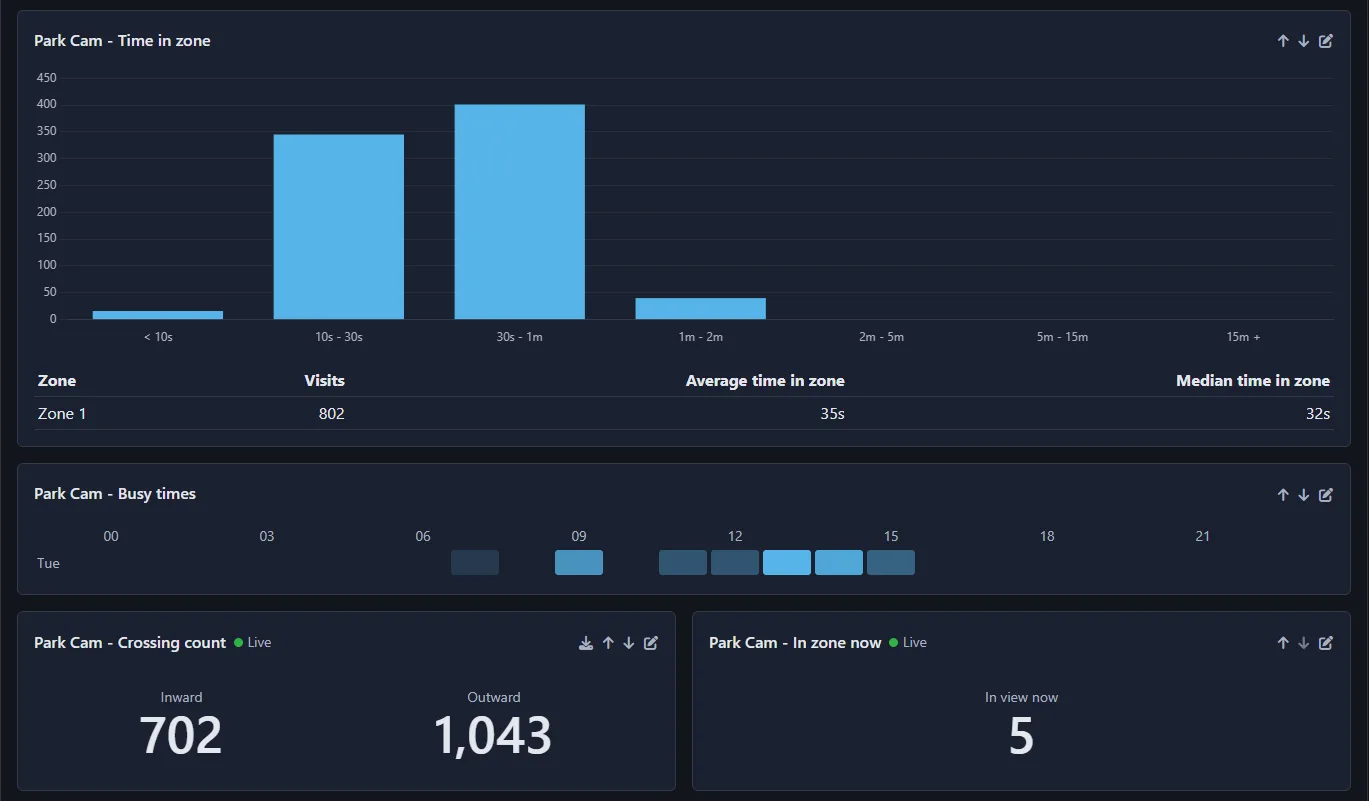
- Crossing count: Two large figures, Inward and Outward, for the lines you tick over the dashboard's period. Updates live.
- In zone now: One large figure: how many objects are in the zones you tick at this moment.
- Lines: A chart of crossings through the period and a table of each line's Inward, Outward, Total and Following closely counts.
- Zones: A table of each zone: in view now, visits, average and median time in zone, and peak count.
- Time in zone: How long visits lasted, as a chart of bands from under 10 seconds to over 15 minutes, with each zone's visits, average and median time. Shows at a glance whether people pass through or stay.
- Queue length: The longest queue in a zone through the period. Only objects that have been in the zone for 5 seconds count as waiting, so people walking through are not a queue.
- Busy times: A grid of days and hours for a camera, brighter where there were more objects in its zones. Shows your busy hours across a week or month.
- Movement between zones: How many objects went from each zone of a camera to each other zone. Needs at least two zones.
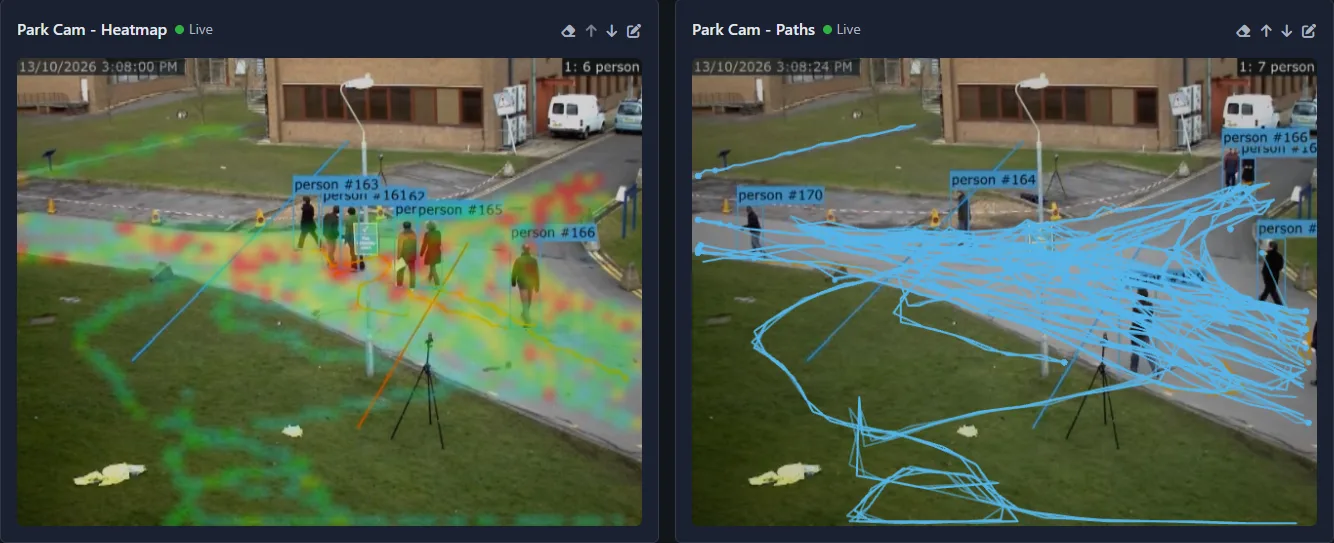
- Heatmap: Where objects spent time on a camera, drawn over its live video: blue for a little, through green and yellow to red for the most.
- Paths: The routes the most recent objects took across a camera's view (the latest 40), drawn over its live video.
- Live view: The camera's live video with each zone's name and the number of objects in it.
- Occupancy: The current count of a counter as a large figure, with its capacity and free spaces if it has a capacity. Has a full screen button for a display at an entrance.
- Occupancy history: A chart of a counter's count through the period.
- Speed: The average and top speed from a speed measurement, with a chart through the period.
Group by
Lines and Zones reports have a Group by setting:
- Line / Zone: A row and a colour for each line or zone.
- Object class: A row for each kind of object (person, car and so on), added up over the report's lines or zones.
- All together: Everything added into one. Use this for a shop with several doors, each with its own line or camera, that you want to see as one entrance.
Heatmaps and paths
Heatmap, Paths and Live view reports draw over the camera's live video while it is online and the dashboard's period runs up to now. For an earlier day, or a camera that is offline, they are drawn over the camera's reference image. The button on a Heatmap or Paths report clears that camera's heatmap or paths for everyone; the counts are not affected.
Emailed Reports, CSV Export and Printing
Emailed reports
A dashboard can email itself to you. Open the dashboard's settings (), set Email report to Daily or Weekly and enter one or more addresses, separated by commas.
- Daily: Sent just after midnight, covering the day that has ended.
- Weekly: Sent just after midnight on Monday, covering Monday to Sunday of the week that has ended.
- Send now: Sends the report straight away so you can see what it looks like.
The email has the dashboard's figures as tables, and its Heatmap and Paths reports as pictures drawn over each camera's reference image. Live reports (Live view, In zone now) are left out. Times are the server's.
Reports are sent through your own mail server if one is set up in Server Settings. Otherwise they are sent by the Agent DVR service, which needs the server to be connected to your account and allows up to 40 report emails a day; each report says how many of the day's allowance have been used.
CSV
The CSV button at the top of the page downloads the figures of the page you are looking at as a file for a spreadsheet. Reports with a button download just that report's rows.
Printing and PDF
The Print button prints the Overview or dashboard you are looking at, laid out for paper in dark text on white. To make a PDF, choose "Save as PDF" as the printer in your browser's print window.