Retail Store Heatmap
See which parts of a shop customers visit, which they walk past, and where they stop.
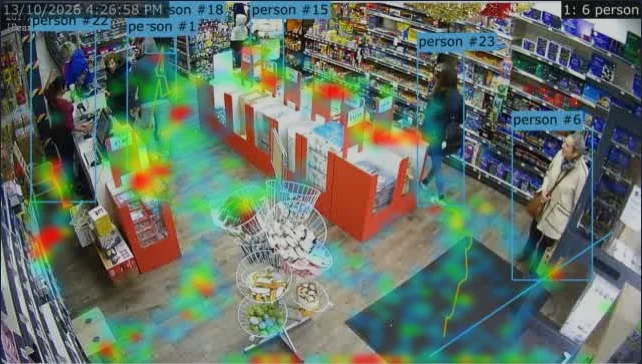
- Choose a camera that looks down on the shop floor and enable analytics on it with Objects set to person.
- Add a dashboard and add a Heatmap report for the camera. Add a Paths report beside it to see the routes people take.
- Leave it running through a normal day. Red areas are where people spent the most time; areas with no colour were not visited.
To put numbers on it, paint a zone over each area you care about (an aisle, a display, the till) and add a Zones report: it shows the visits to each and the average time spent there. A Movement between zones report shows where people go next.
Set the dashboard's period to Last 7 days to compare days, and use the arrows to step back to an earlier day: the heatmap for a day that is over is drawn on the camera's reference image. After moving a display, use the button on the heatmap to start it again from nothing.
Parking Bay Occupancy
Show which parking bays are taken, how long vehicles stay, and be told when a reserved bay is used.
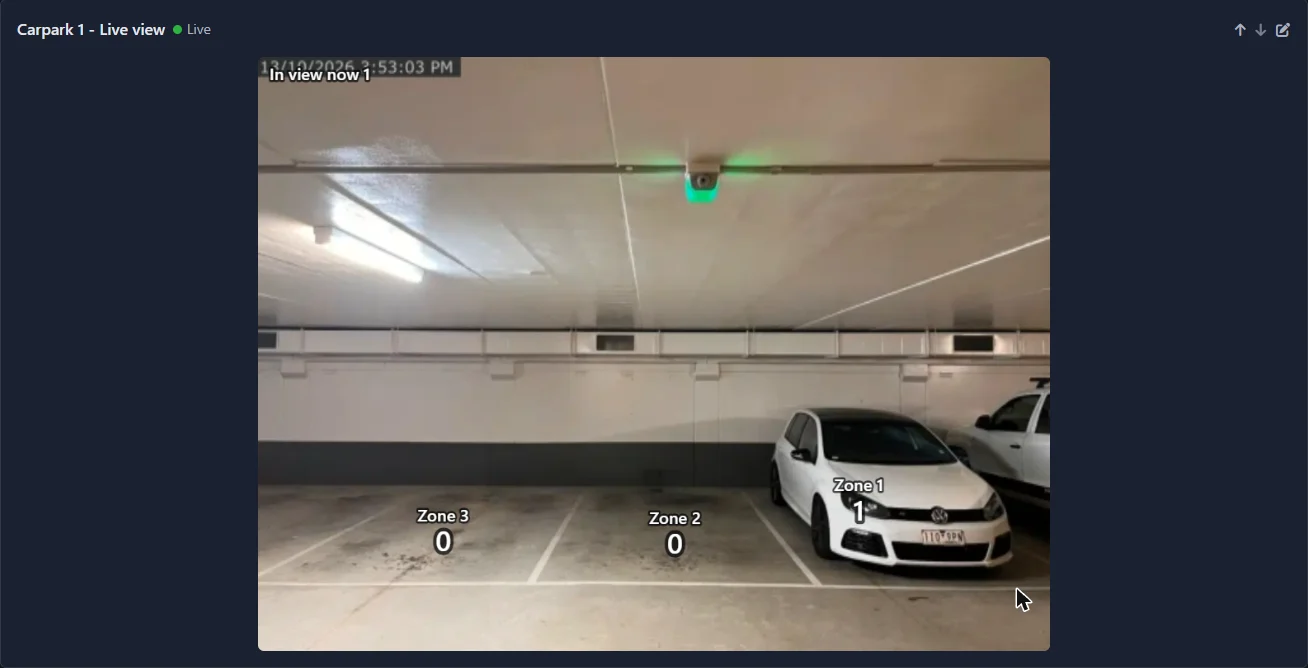
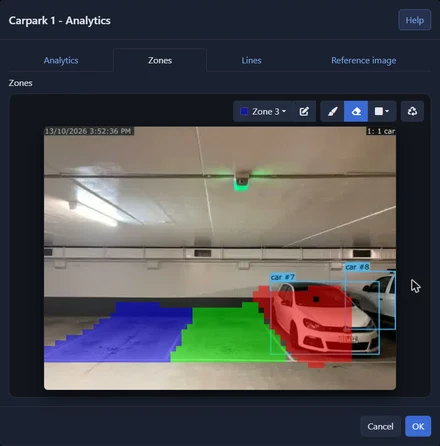
- Enable analytics on a camera that can see the bays, with Objects set to the vehicles you expect: car, truck, motorcycle.
- On the Zones tab paint one zone over each bay and name it ("Bay 1", "Disabled bay", "Loading bay"). A vehicle is in the bay whose paint is under the middle of the bottom edge of its box, so paint the ground where the vehicle stands and keep the paint inside the bay's lines. A camera can have up to 9 zones, so use a second camera for more bays.
- Add a Zones report with the bays ticked. In view now is 1 for a bay that is taken and 0 for a free one, and Average time in zone is how long vehicles stay.
- Add a Live view report to see the count written on each bay over the camera's picture, and an In zone now report with all the bays ticked to show how many are taken as one large figure.
Mount the camera high, looking down on the bays. From a low camera the vehicles in the row behind appear on top of the bays in front and are counted in them. If a bay shows more vehicles than it holds, switch on Overlay in the camera's analytics settings to see the box around each vehicle, and trim the zone so only the vehicle in the bay stands on it. A vehicle the AI does not recognise is not counted: lowering Confidence can help.
For a reserved or loading bay, add an alert: Objects in a zone, at or above 1, for at least 30 seconds, so a car driving through does not set it off. To catch overstaying, use Time in a zone with the number of seconds allowed.
For a whole car park where the bays cannot all be seen, count at the entrance and exit instead: see Maximum Occupancy.
Queue Monitoring and Wait Times
Know how long the queue gets, how long people wait, and be told when another till should open.
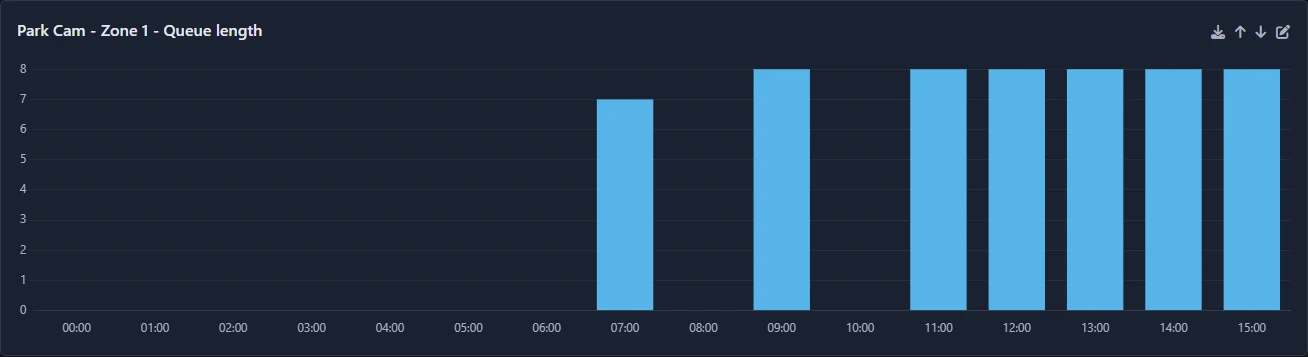
- Enable analytics on a camera that sees the queue from above or from the side, with Objects set to person.
- Paint a zone over the floor where people wait and name it ("Checkout queue"). Leave out the space where staff stand and where people walk past.
- Add a Queue length report for the zone. It shows the longest queue in each hour or day. Only people who have been in the zone for 5 seconds count, so someone walking through is not counted as waiting.
- Add a Time in zone report for the same zone to see how long people waited: the chart shows how many waited under 30 seconds, up to a minute, up to two minutes and so on, with the average and median.
- Add an In zone now report for a live figure.
To be told when the queue is too long, add an alert: Queue in a zone, at or above the number you choose, for at least 20 seconds. Set Active from and Active until to your opening hours. The alert can show a notification, send an email, or call a URL - for example to sound a chime or post to a staff chat.
A Busy times report for the camera shows the hours of the week when queues build, which helps with staffing.
Occupancy Counting and Capacity Limits
Keep a running count of how many people are inside a building or room, or vehicles in a car park, against its capacity - including when it has several entrances and exits on different cameras.

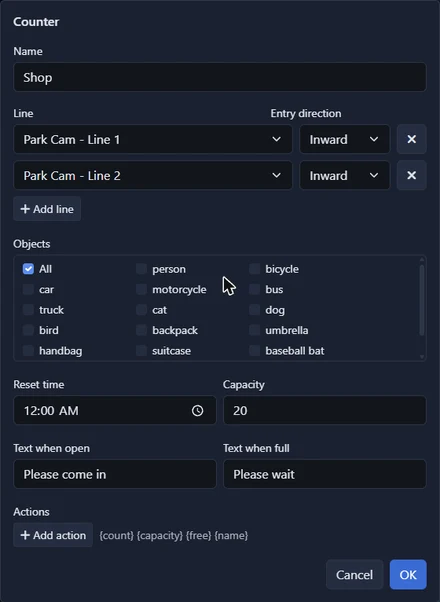
- Enable analytics on a camera at every way in and out. A door that is not counted makes the total wrong.
- On each camera draw a line across the doorway and name it ("Main entrance", "Side door", "Fire exit"). Note which way each line's arrow points.
- Click Counters, then Add counter. Use Add line to add every one of those lines, from all the cameras, and for each set the Entry direction that means coming in (Inward if the arrow points into the building, Outward if it points out). An exit-only door is added the same way: its crossings only ever take the count down.
- Enter the Capacity and a Reset time when the place is empty, such as 04:00.
- Add an Occupancy report to a dashboard for the live count and free spaces, and an Occupancy history report to see how full it was through the day.
To act when it is nearly full, add an alert of the kind Occupancy, at or above a number a little below the capacity. To act the moment it is full, give the counter an action that calls a URL at or above the capacity, and another at or below one less than the capacity to undo it.
No counter is perfect: two people walking through side by side, or someone turning back in the doorway, can be miscounted. Place cameras so people cross the line one at a time where you can, check the count against reality now and then, and correct it with Set count.
Go / Wait Occupancy Display
Put a screen at the door that tells people whether they can come in: green with your "go" message while there is room, red with your "wait" message when the place is full.
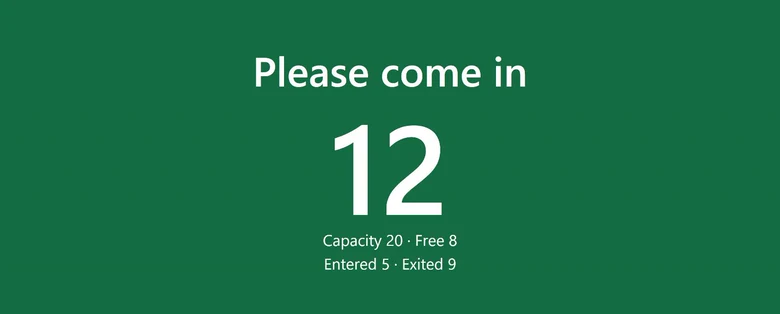

- Set up a counter with a Capacity as in Maximum Occupancy.
- In the counter's settings enter Text when open, for example "Please come in", and Text when full, for example "Please wait".
- Add an Occupancy report for the counter to a dashboard.
- On the screen at the door, open Agent DVR in a web browser, go to that dashboard and click the full screen button on the Occupancy report.
The display fills the screen with the count, your message and the number of free spaces. It turns red as soon as the count reaches the capacity and green again when someone leaves. It keeps itself up to date; press Esc to leave full screen.
Any device with a browser will do: a tablet on a stand, or a small computer plugged into a TV. It needs an administrator login to Agent DVR, so use a device that customers cannot operate. To drive a real light or barrier instead of a screen, use the counter's actions to call a URL when it becomes full and when there is room again.