People Counting and Video Analytics
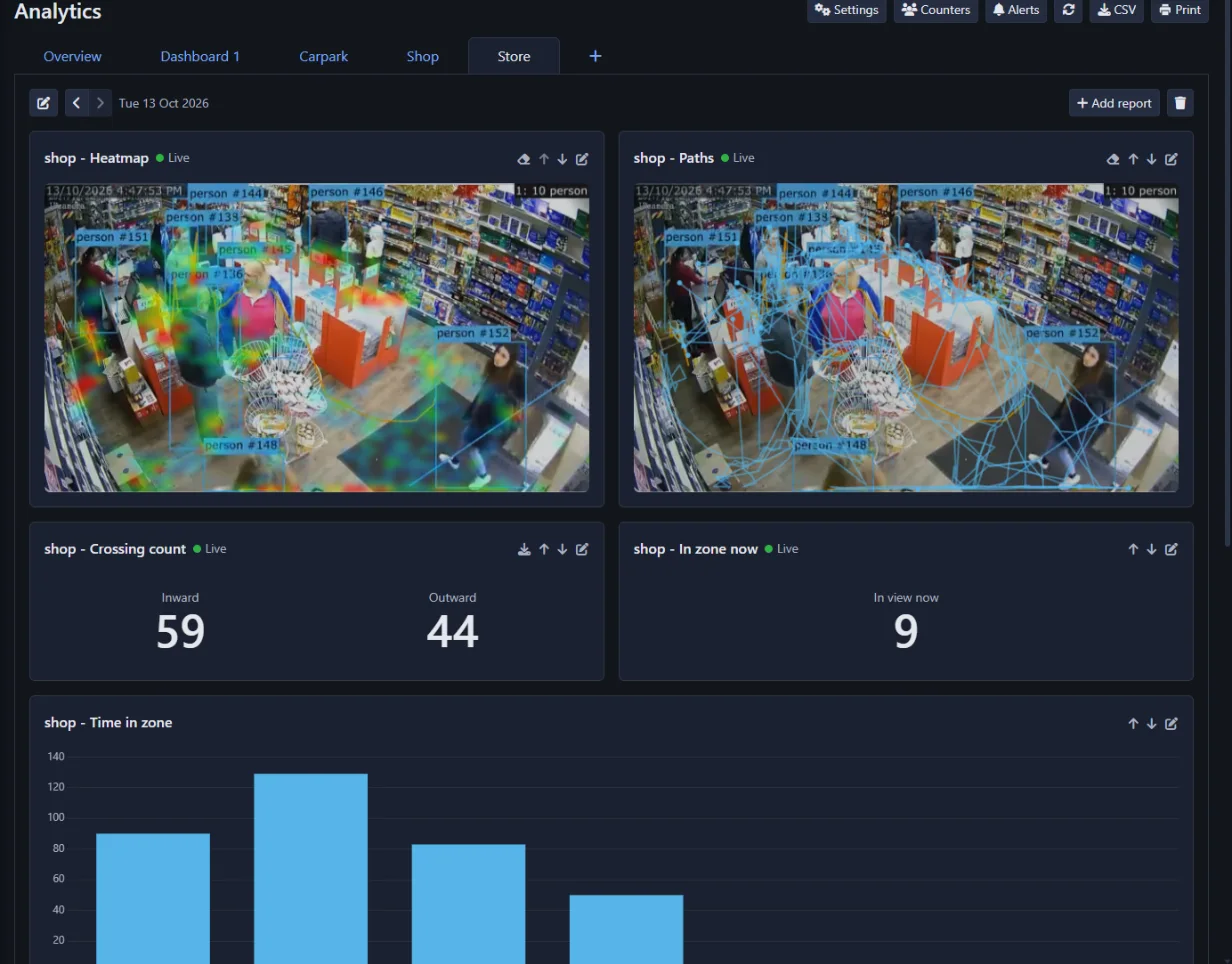
Analytics turns your cameras into people and vehicle counters. You draw lines and zones on a camera and Agent DVR counts what crosses the lines and measures what happens in the zones: how many came in and went out, how busy it was and when, how long people stayed, how long the queue got, where they walked and how fast they were going. The results are shown as live figures, charts, heatmaps and tables on dashboards you build yourself, and can be emailed to you every day or week.
Everything runs locally on your own computer using Agent DVR's built-in AI. No video or images are sent to a cloud service.
What you need
- A Standard or Professional subscription. Analytics is not part of the Basic plan.
- An administrator login. Analytics is not shown to other users.
- A camera with a clear view of the area. A high viewpoint looking down works best, because people hide each other less.
Getting started
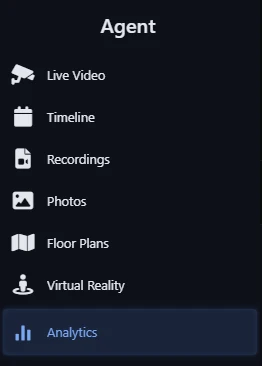
- Click the menu button at the top left and select Analytics.
- Click Settings, then the button next to the camera you want to count on, and switch on Analytics enabled. See Setting Up a Camera.
- Draw at least one line or zone on the Lines and Zones tabs. See Zones and Lines.
- Click OK. Counting starts straight away and the camera appears on the Overview.
The first time analytics is switched on, Agent DVR downloads the detection model it needs. A notice at the top of the Analytics page tells you while it is downloading; counting starts when it is installed.
Analytics is separate from Object Recognition. It has its own settings, zones and lines for each camera, and it does not raise camera alerts or run camera actions. It has its own alerts instead.
Setting Up a Camera for Counting
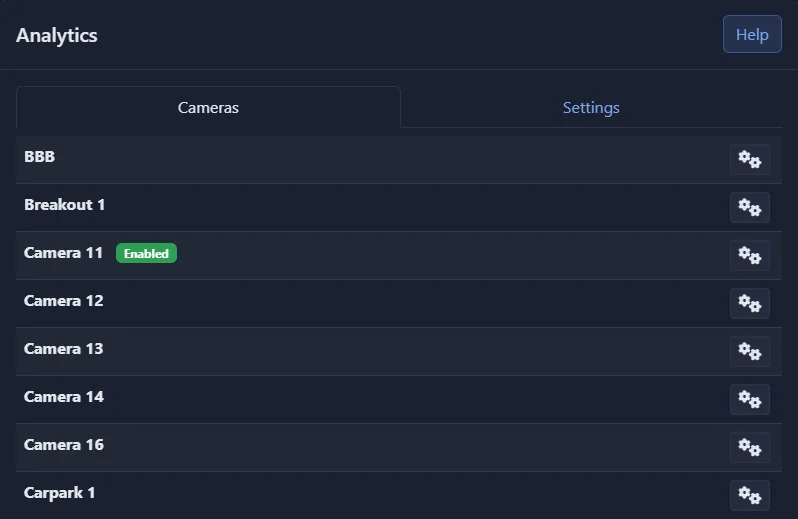
On the Analytics page click Settings. The Cameras tab lists your cameras. Cameras that are being counted on are marked Enabled. Click the button next to a camera to open its analytics settings.
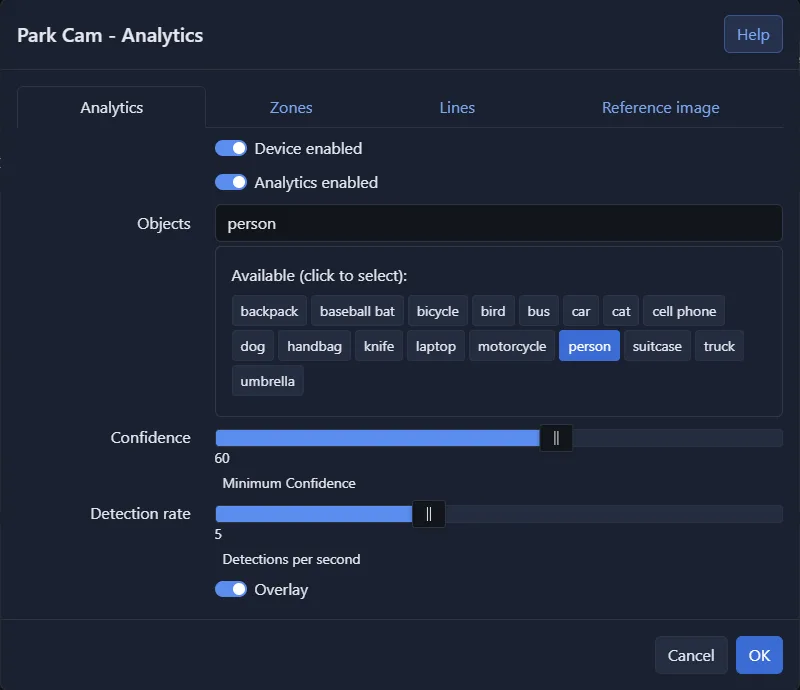
- Device enabled: Switches the camera itself on or off, the same as the power button in the live view. A camera that is off counts nothing.
- Analytics enabled: Switches counting on for this camera.
- Objects: What to count, for example person, car, truck or bicycle. Choose only what you need.
- Confidence: How sure the AI must be before an object is counted. Raise it if things are being counted that are not there; lower it if objects are being missed.
- Detection rate: How many times a second the camera is checked (2 to 10). Fast-moving objects such as vehicles need a higher rate. A higher rate uses more processing power.
- Overlay: Draws a box and number on each tracked object, its trail, and your lines on the live video. Useful when setting up.
Server settings
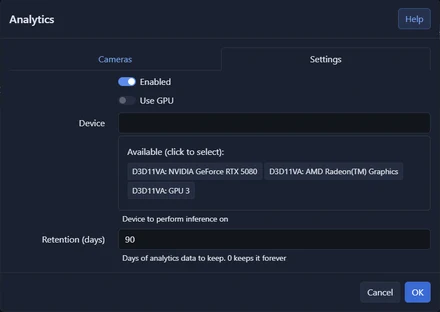
The Settings tab of the same window has the settings shared by all cameras:
- Enabled: Switches analytics on or off for the whole server.
- Use GPU: Runs the detection model on your graphics card instead of the CPU. Recommended when several cameras are being counted on.
- Device: Which graphics device to use.
- Retention (days): How long analytics data is kept. The default is 90 days; 0 keeps it forever.
Counting Lines and Zones
Everything Analytics reports comes from the lines and zones you draw on a camera, so it is worth a few minutes to place them well. Both are drawn in the camera's analytics settings (Analytics - Settings - next to the camera).
Lines
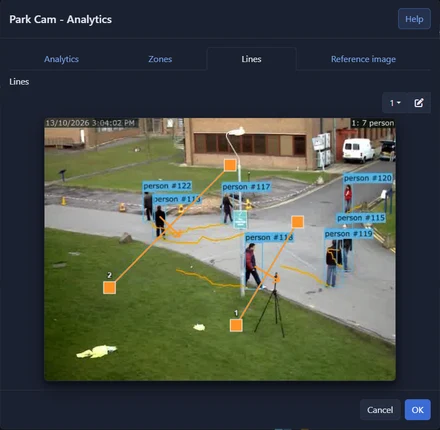
A line counts objects that cross it, in each direction. Use lines for doors, gates, corridors and roads.
- Draw a line by dragging on the picture on the Lines tab. Drag its ends to move it. A camera can have up to 10 lines.
- The arrow on a line points Inward. Crossings the other way are counted as Outward. To swap them, draw the line the other way round.
- Use the button to give the selected line a name, such as "Front door". The name is used in every report.
- Place a line where people are fully in view and moving across it, not where they stand around. Leave room on both sides: an object is counted when it has clearly passed over the line.
Lines also report Following closely: an object that crosses within a second of the one in front, in the same direction. At a door with access control this is tailgating.
Zones
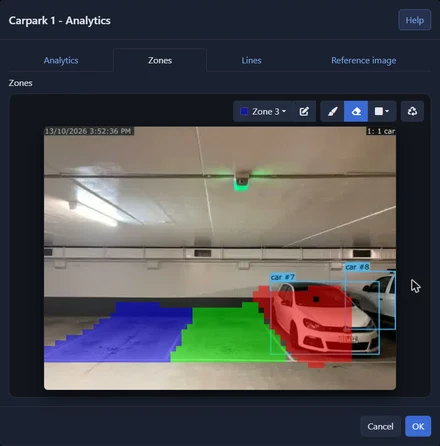
A zone is an area you paint on the picture. Analytics reports how many objects are in it now, how many visited, how long they stayed and how long the queue was. Use zones for a till, a waiting area, a shop aisle, a parking area or a doorway where people should not linger.
- Choose a zone from the list on the Zones tab and paint it with the brush. Use the eraser to remove paint. A camera can have up to 9 zones.
- Use the button to name the selected zone.
- An object is in a zone when the point where it touches the ground is in the zone, so paint the floor people stand on, not the space their heads pass through.
A camera with no lines and no zones is treated as one zone covering the whole picture, shown as Whole frame.
Reference image
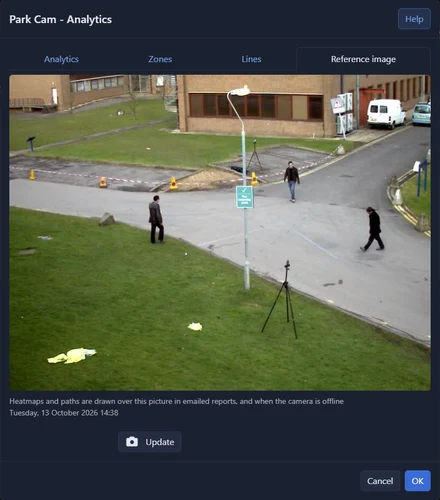
Each camera keeps one still picture of its scene, the reference image. Heatmaps and paths are drawn over it in emailed reports, and on the page when the camera is offline or you are looking at a day that is over.
Agent DVR takes the reference image by itself from the first picture that is not dark once analytics is running on the camera. To replace it, for example with one taken when the scene is empty, open the Reference image tab and click Update. The camera must be switched on.